
2026-08-26 · Article
Nobody Published the Denominator
A deflection benchmark quoted across the industry traces to no primary source. It looks entirely reasonable, which is exactly what makes it dangerous.
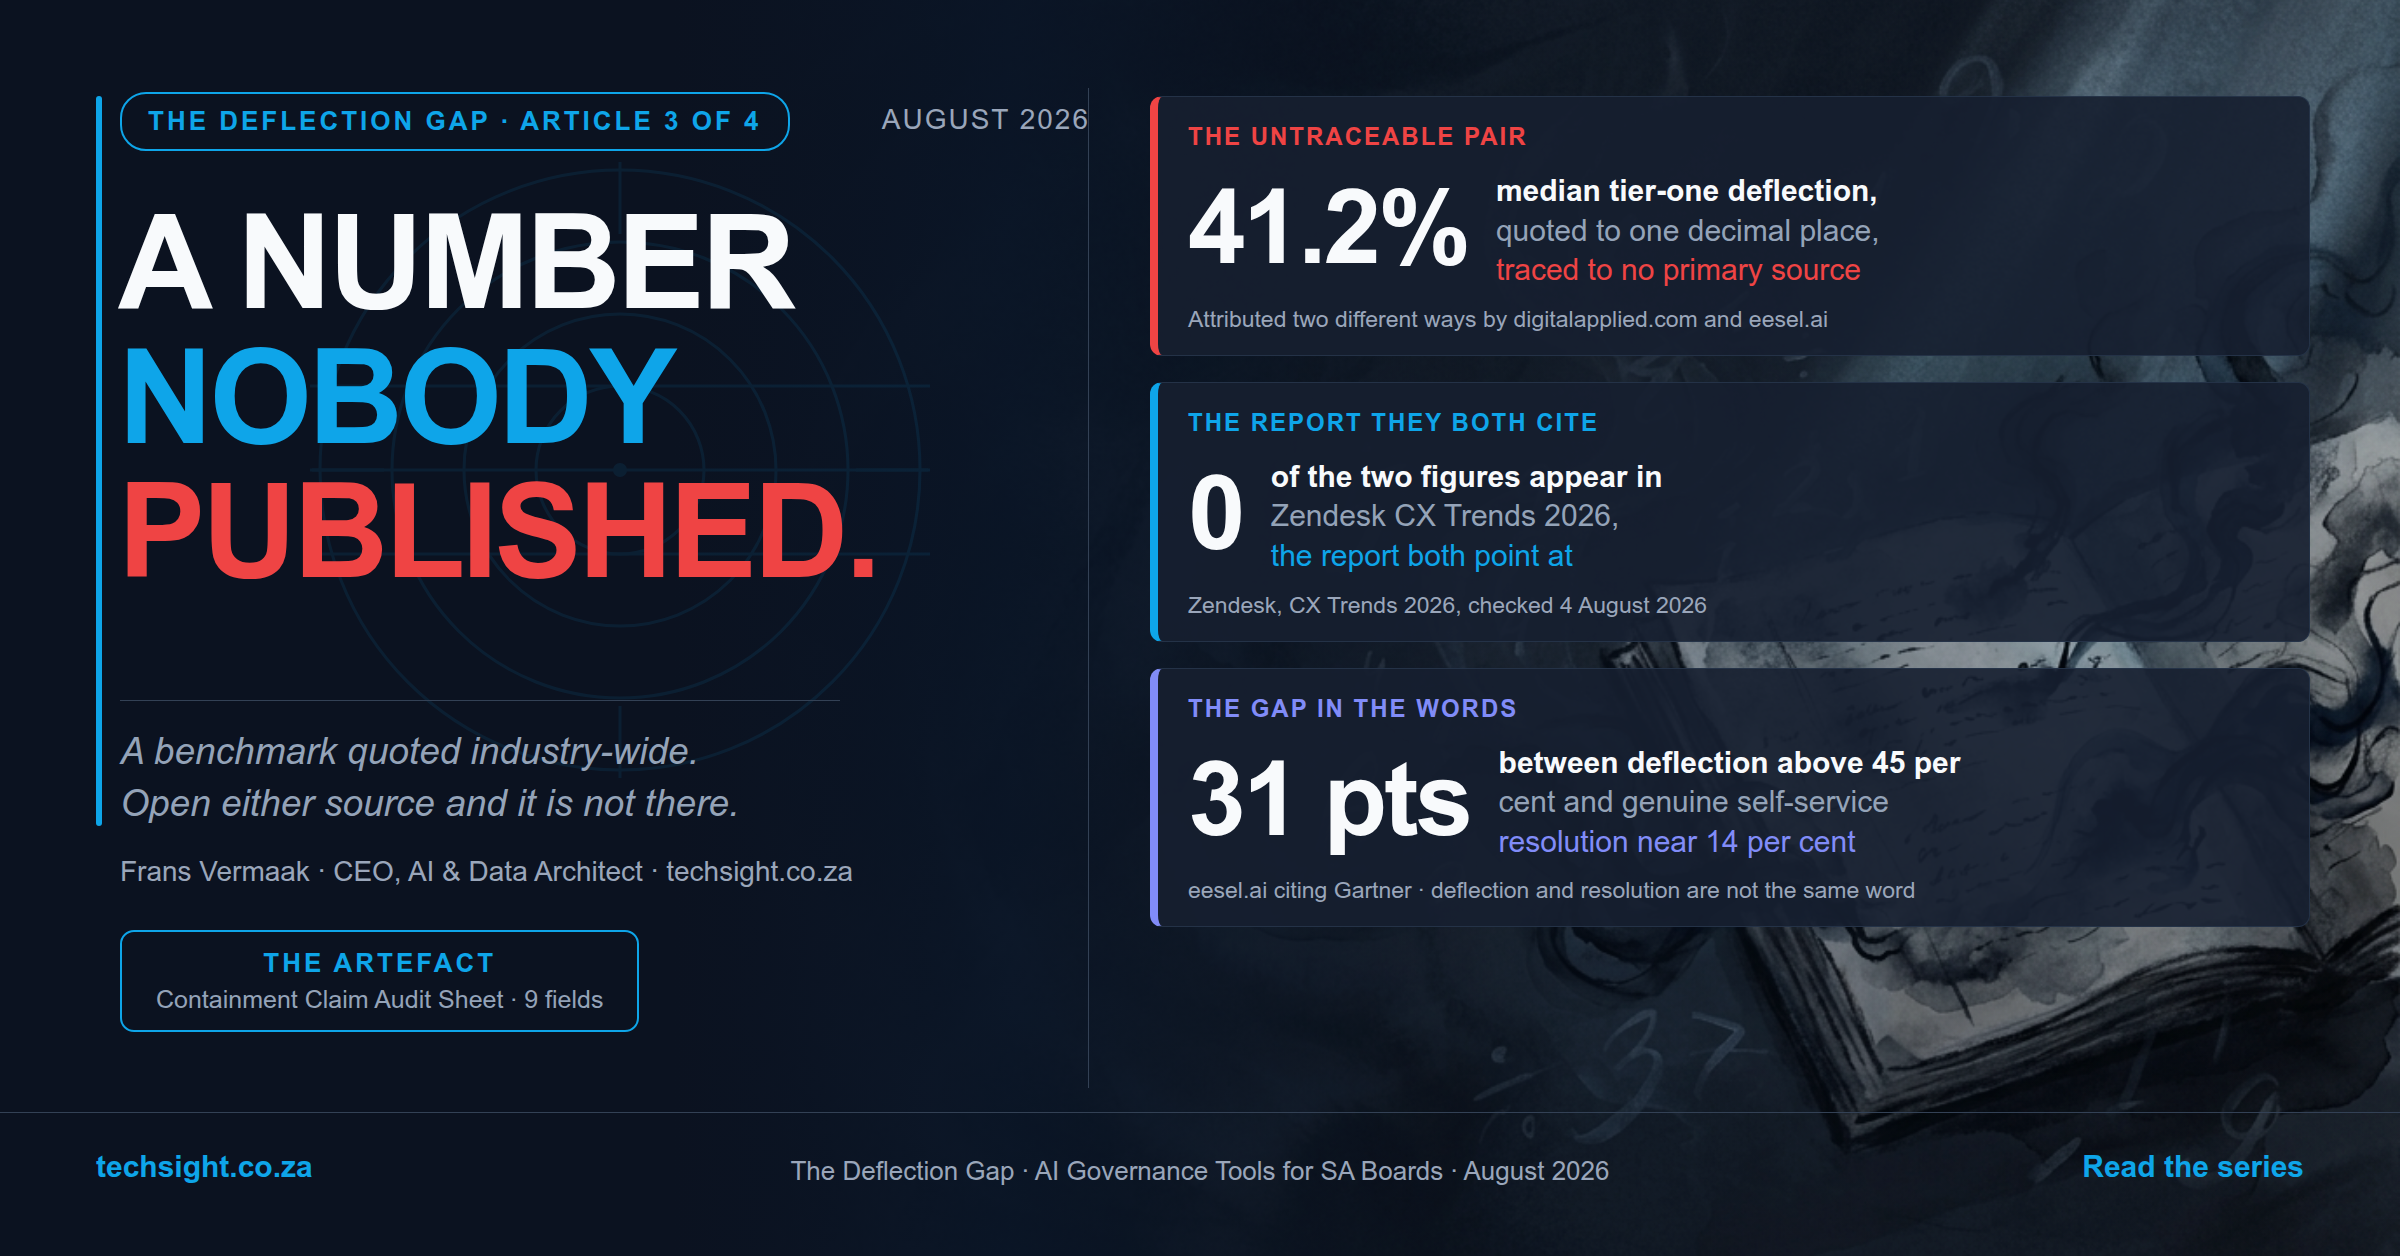
On 4 August 2026, we went looking for a number.
It appears throughout 2026 contact-centre content: median tier-one deflection of 41.2 per cent, top quartile 58.7 per cent. Two decimal places. The kind of precision that reads as measurement rather than estimation, the kind you copy into a board pack without annotating it because it looks like someone has already done the work.
Two publications credit it. digitalapplied.com attributes both figures to Zendesk CX Trends 2026 and links directly to the report. eesel.ai attributes the same pair to 'Zendesk CX Trends and Salesforce State of Service data aggregated by ClarityArc'. The same decimals also circulate presented as ClarityArc’s own production benchmarks, though we could not pin that third attribution to a publisher we would be willing to name. We are aware of the irony of writing that sentence in this article.
We opened Zendesk CX Trends 2026. Neither figure is in it. We could not locate any primary ClarityArc document.
This is not a story about fraud. If someone had fabricated these figures, they would have chosen round numbers, or at least avoided the second decimal place. A fabrication is, in one narrow sense, simpler to fight: you find the lie, you name it, you move on. What we are dealing with here is harder. The figures exist, are cited by two named publications, and cannot be traced to a publisher. Nobody is obviously lying. Accusing people of lying would be easier to write, and the evidence does not support it.
The reason nobody notices is the thing this article is actually about.
The 58.7 per cent figure sits comfortably inside Gartner's published best-in-class band for AI deflection, which runs 40 to 60 per cent. Industry average on the same basis runs 20 to 30 per cent. A note on those Gartner figures, stated in the body rather than a footnote because it matters to the argument: they reach us through a secondary reconciliation published by servicedeskagents.com, not through a primary Gartner document we could open. Gartner sells research. We are citing a summary of it.
The practical consequence of that credible range is this: 58.7 per cent does not trigger scepticism. It is in the right postcode. A number does not have to be outlandish to be unusable. It only has to be unattributable. That sentence is the whole article. The mechanism behind it takes some unpacking.
Four words are doing serious work in this conversation: deflection, containment, resolution, and automated resolution. They are used as synonyms throughout vendor materials and analyst decks. They are not synonyms.
Zendesk counts a deflection when a self-service article is viewed and no ticket opens within 24 hours. The customer may have given up. The customer may have called on a different channel. If no ticket appears in that window, the contact is deflected. That is the entire criterion.
Zendesk's standard for an automated resolution is considerably stricter. The AI must deliver an accurate answer, complete any required action, and generate no follow-up contact. It must finish the task end to end, use current information, avoid escalation, and produce no repeat contact. Zendesk explicitly excludes abandoned chats, unresolved closures, vague answers, and contained interactions where the user stopped engaging rather than being helped. These are two metrics from the same vendor describing different realities. One counts absence of a ticket. The other counts evidence of an answer.
Intercom runs a third model. Its Fin AI agent reports two resolution types. A confirmed resolution is where the customer indicates the answer helped. An assumed resolution is where the customer 'exits the conversation without requesting further assistance' within 24 hours. Intercom bills per resolution and deducts the charge if the customer returns to the same conversation. Intercom cites a 76 per cent average resolution rate across its customers. That figure is real, attributable, and publicly stated. It is also not comparable to either of the Zendesk metrics, because the assumed category makes 'exits without requesting further assistance' a more generous reading of success than 'task completed end to end'.
Containment is narrower than deflection: the contact did not escalate to a human. Resolution is the narrowest of the four, and is the only one that describes a customer's problem actually being solved. Cross-vendor comparison of these numbers is unreliable by default. Not because anyone is cheating, but because the words differ.
There is a result here that looks contradictory until you see what is happening.
eesel.ai, citing Gartner, states that AI deflects more than 45 per cent of queries while around 14 per cent reach genuine self-service resolution, a gap of roughly 31 percentage points. Alongside that, the same secondary reconciliation gives Gartner’s strict definition, which counts a deflection only where the AI resolved the request with no human involvement and the user did not re-open it within 72 hours, and puts the industry average at 20 to 30 per cent. A reader who spots both numbers in the same piece and pushes on the apparent contradiction has understood this article better than one who accepts them without noticing. The 14 per cent and the 20 to 30 per cent are not in conflict. They are not measuring the same thing. The 20 to 30 is deflection under a strict definition, with no human involvement and no re-contact within 72 hours. The 14 per cent is genuine self-service resolution, the strictest measure of all, meaning the customer's problem was actually solved without help or return. These two figures can coexist at any operation without contradiction because they describe different slices of the same contact volume. The numbers differ because the words differ. That is the entire point of the piece.
There is a human cost to this definitional fog, and it arrives somewhere most operations do not expect.
A Frost and Sullivan think tank session found some participants reporting that average handling time rose after deploying AI and others reporting it fell, and traced both results to the same cause: AI absorbs simple tier-one contacts and leaves human agents to handle the complex, higher-effort ones. Pathstream reported this finding. Parloa, writing in CX Today, made the arithmetic explicit: average handling time can rise while total handling time falls. Aspect, in a paper titled KPI Drift: rethinking contact centre performance in the age of agentic AI, documents how the same mix-shift distorts not just AHT but ASA, occupancy and benchmarking. Supervisors end up coaching from a stream of escalations rather than a normal spread of calls.
If you are using AHT as a performance target, you are likely penalising your best agents for taking the hardest calls. That is the human cost of a definition problem: not bad intent, not bad people, but a measurement designed for a different mix applied to a changed one.
This is the mechanism that Articles 1 and 2 were pointing at without being able to name it.
Article 1 showed consumers requesting a human within three minutes. Article 2 showed a bank cutting 45 roles on a projection that did not survive contact with operational reality. The thread connecting both is that nobody had agreed what a resolved contact was before the pilot went live. The figures in the board pack were measuring something different from what happened to customers.
A contained call that ends in a transfer consumes a full human interaction anyway, plus the caller's time with the machine. And if a deflection is measured inside a 24-hour window while the invoice it justifies is measured across a month, the two are not counting the same period. That is arithmetic rather than a finding about any particular vendor’s billing. Contacts returning after the window closes count as successes in the first metric and fresh volume in the second. Ten percentage points on a million-contact operation is a hundred thousand contacts. State that conditionally: the ten points come from the secondary reconciliation, and the secondary reconciliation's causal explanation is its own inference.
The remedy is one page and it is the most useful thing this series has produced.
Before signing anything, require the vendor to state in writing: which metric is being quoted; the exact definition used; the re-contact window counted, if any; whether an abandoned session counts as resolved; whether a transfer counts as contained; the sample size and measurement period; who measured the figure and whether a third party verified it; and the same figure restated as cost per resolved contact.
Then measure your own baseline on those same fields before the pilot begins.
That is the containment claim audit sheet. Not a methodology dispute and not a vendor negotiation: a one-page request for the birth certificate.
Article 4 asks what you do when the pilot finishes and the numbers look right.
The artefact
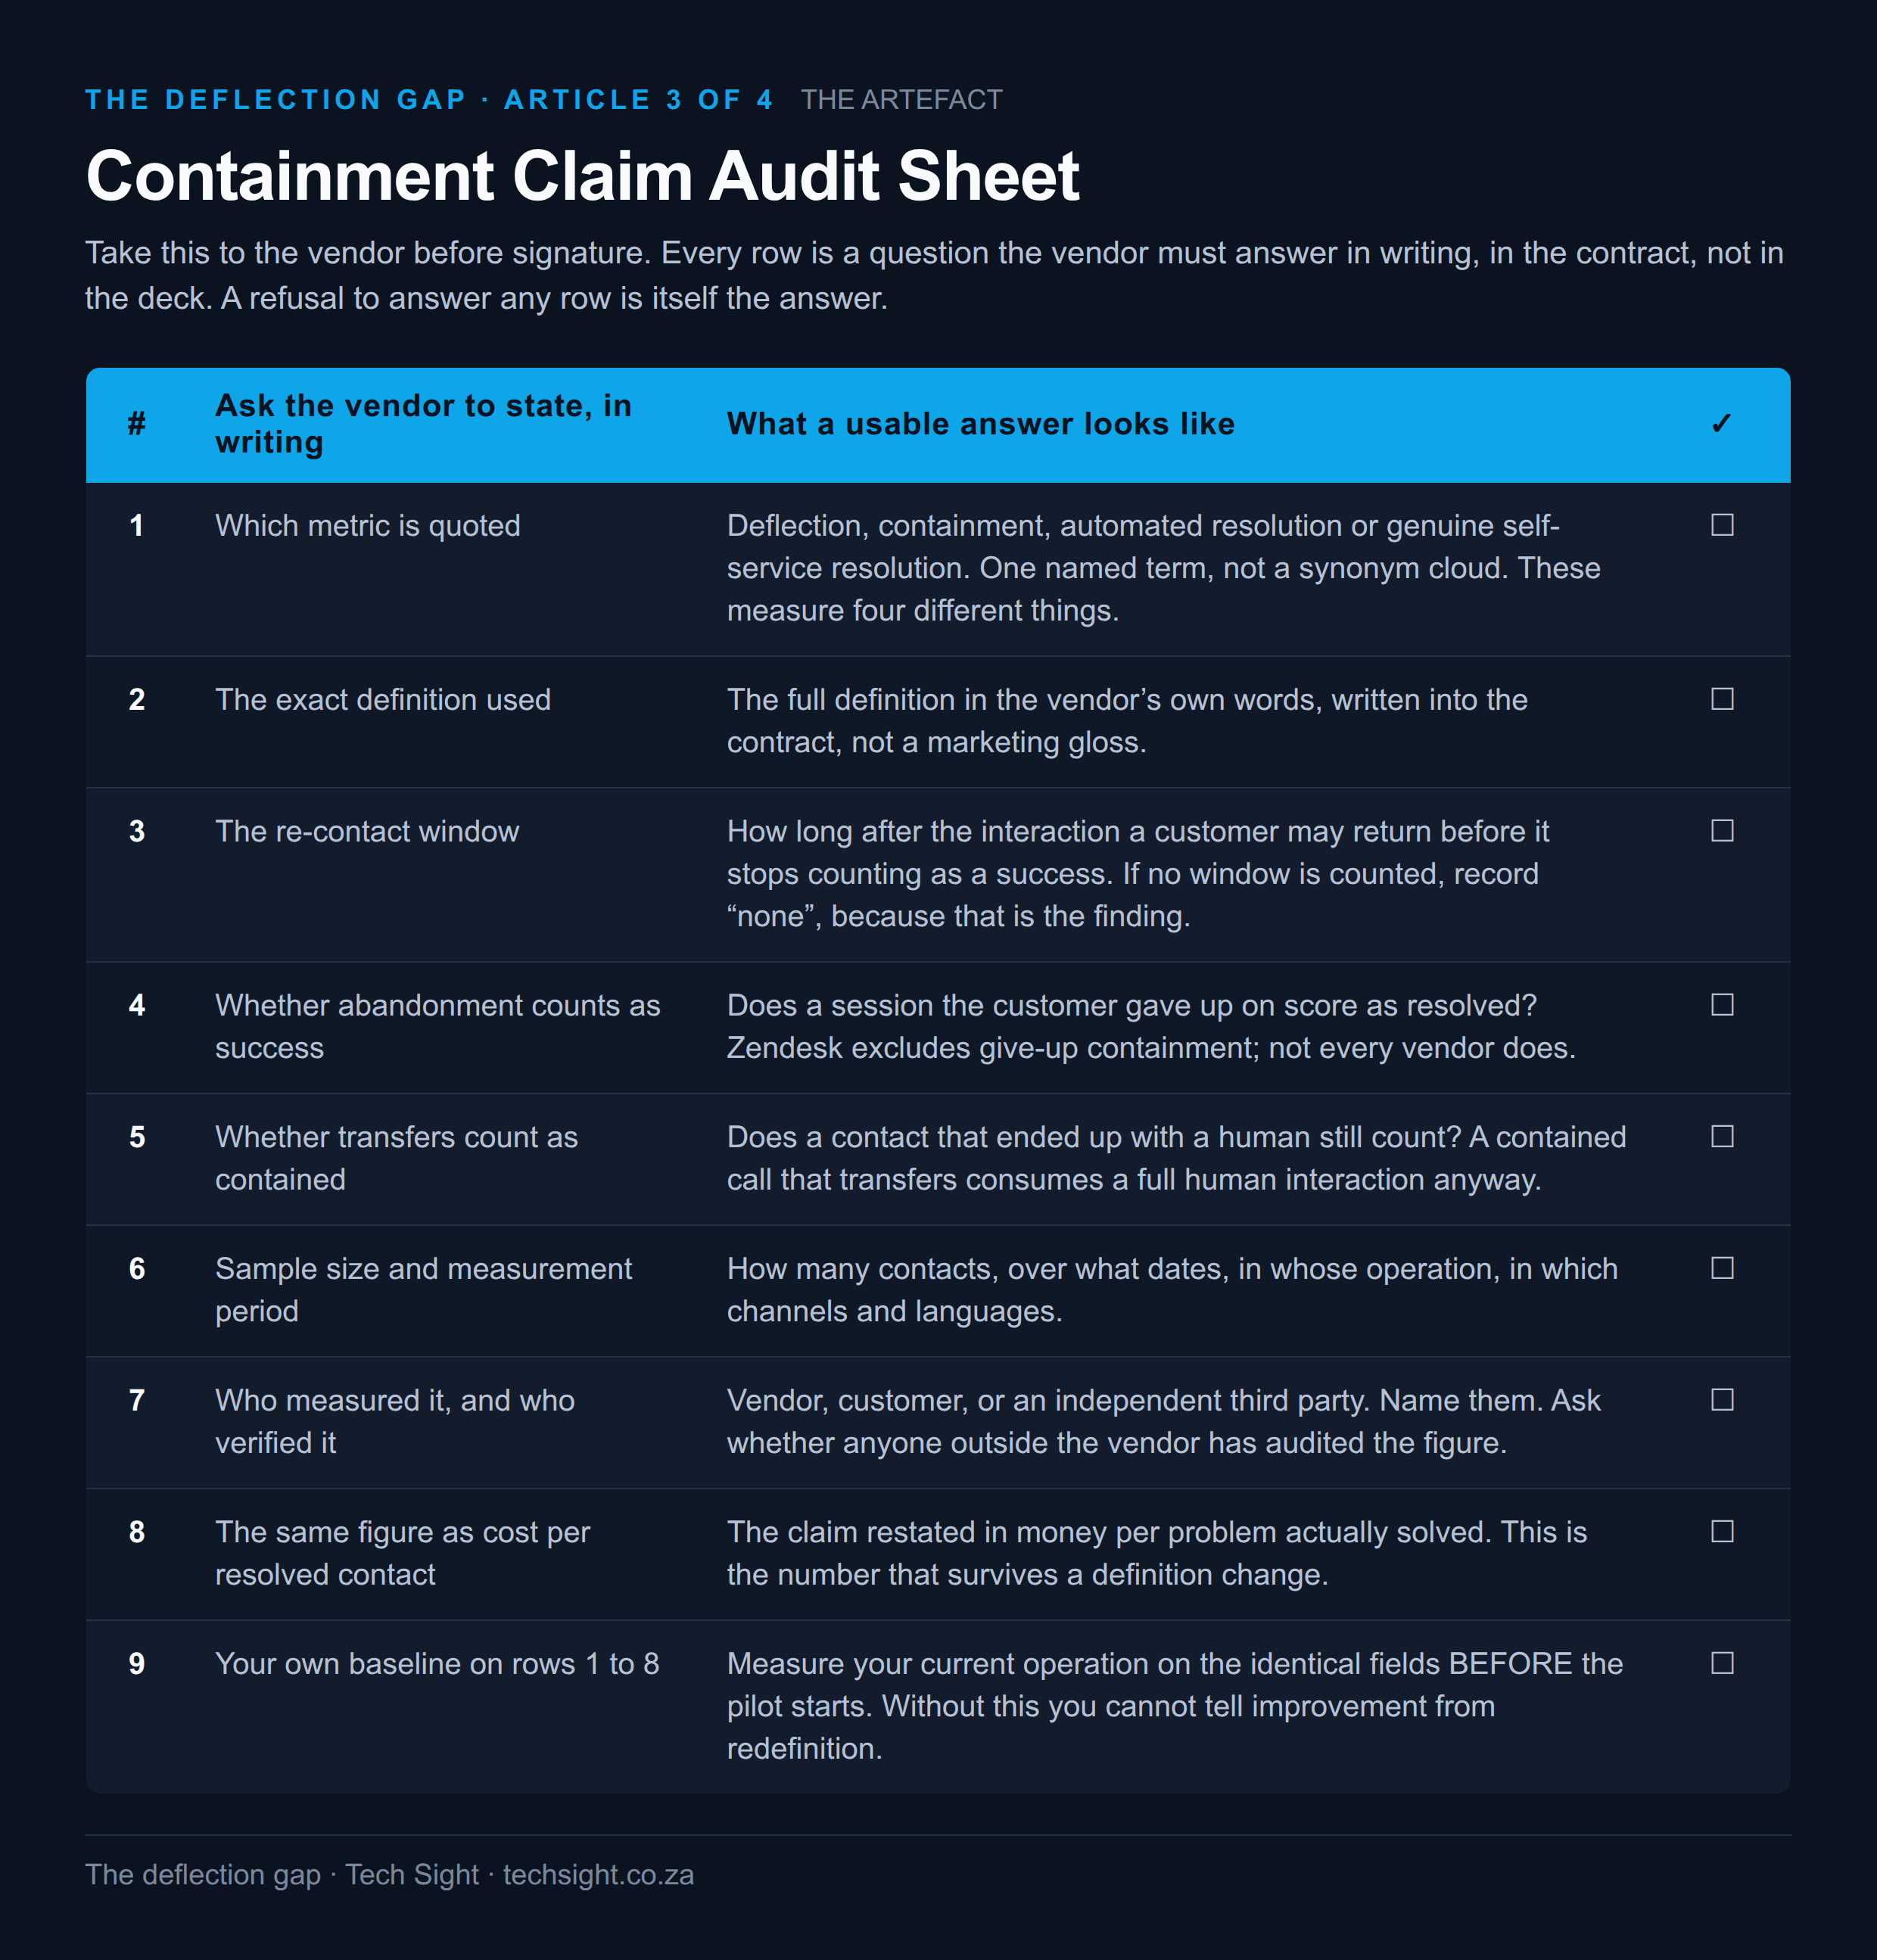
Artefact: Containment Claim Audit Sheet, the nine fields above, one page.
Sources
| Claim | Source | Checked |
|---|---|---|
| The 41.2 / 58.7 pair attributed to Zendesk CX Trends 2026 with a direct link | digitalapplied.com, AI Customer Support 2026: 50+ Adoption + ROI Data Points | 2026-08-04 |
| The same pair attributed to 'Zendesk CX Trends and Salesforce State of Service data aggregated by ClarityArc' | eesel.ai, Deflection rate in AI support (2026) | 2026-08-04 |
| Zendesk CX Trends 2026 contains neither figure; its published statistics are the 83 / 85 / 88 per cent consumer and leader figures | Zendesk, CX Trends 2026, cxtrends.zendesk.com | 2026-08-04 |
| Zendesk standard for automated resolution: accurate answer, action completed, no follow-up; excludes abandonment and give-up containment | Zendesk, Automated resolution rate: how to measure and improve it | 2026-08-04 |
| Zendesk deflection counted on article view with no ticket inside 24 hours | Zendesk published metric definitions | 2026-08-04 |
| Intercom Fin confirmed and assumed resolutions; assumed = customer exits without requesting further assistance; billed per resolution; deducted if the customer returns to the same conversation | Intercom, Fin AI Agent outcomes, intercom.com/help | 2026-08-06 |
| Gartner strict definition and the 20 to 30 / 40 to 60 bands, vendor figures about ten points higher | Reached via a secondary reconciliation (servicedeskagents.com), not a primary Gartner document. Disclosed as such in the body | 2026-08-04 |
| Deflection above 45 per cent against roughly 14 per cent genuine self-service resolution | eesel.ai, citing Gartner | 2026-08-04 |
| AHT rising and falling from the same cause; the performance-target warning | Frost and Sullivan think tank session, as reported by Pathstream | 2026-08-06 |
| Average handling time can rise while total handling time falls | Parloa, via CX Today | 2026-08-06 |
| Findings of the earlier articles in this series, as summarised here | Tech Sight, The Deflection Gap, articles 1 and 2, each carrying its own sources table | 2026-08-25 |
| Mix-shift distortion of AHT, ASA, occupancy and benchmarking; supervisory drift | Aspect, KPI Drift: rethinking contact centre performance in the age of agentic AI | 2026-08-06 |
Unverified, and used only as such. The 41.2 / 58.7 pair appears here as the object of examination, never as evidence for anything. A second figure attributed to the same report, an 11.3 against 8.7 per cent re-contact split, is equally untraceable, and we have left it out of this article rather than repeat it even to criticise it.
Stated as opinion, not finding. That pilots are rarely instrumented for cost per resolved contact. That is our observation from advisory work, on a small sample.
Interests declared. eesel.ai and digitalapplied.com publish commercial content in the AI support market, which is visible on their own sites. Zendesk, Intercom and Salesforce sell the platforms whose definitions are cited. Gartner, Frost and Sullivan sell research. Parloa and Aspect sell contact-centre software. And ours, plainly, because this series asks you to check who paid for every number you are shown. Tech Sight advises buyers on contact-centre automation. We also sell in this market: agentic AI for document understanding and document intelligence, intelligent chatbots, and an equity interest in Kobliat, an intelligent contact-centre platform owned by a separate company. That puts us in the same category as several of the vendors cited above. We have published their numbers rather than ours, and every figure here is traceable to a named source with its methodology stated, so that you can check us the way we are asking you to check them.
Correction policy: if the 41.2 per cent figure exists in a primary published document, send it and this article will carry the correction and the citation at the top.
Book the two-hour diagnostic